The post LTC Price Analysis: Litecoin Dump Begins, Falls 20% In A Week; Time To Exit? appeared first on Coinpedia Fintech News
With the buyer’s confidence going haywire, the altcoins are struggling to find a solid footing to hold the downfall. With top coins like Bitcoin(BTC) and Ethereum(ETH) down by 7.52% and 6.02%, Litecoin faces intense bearish pressure.
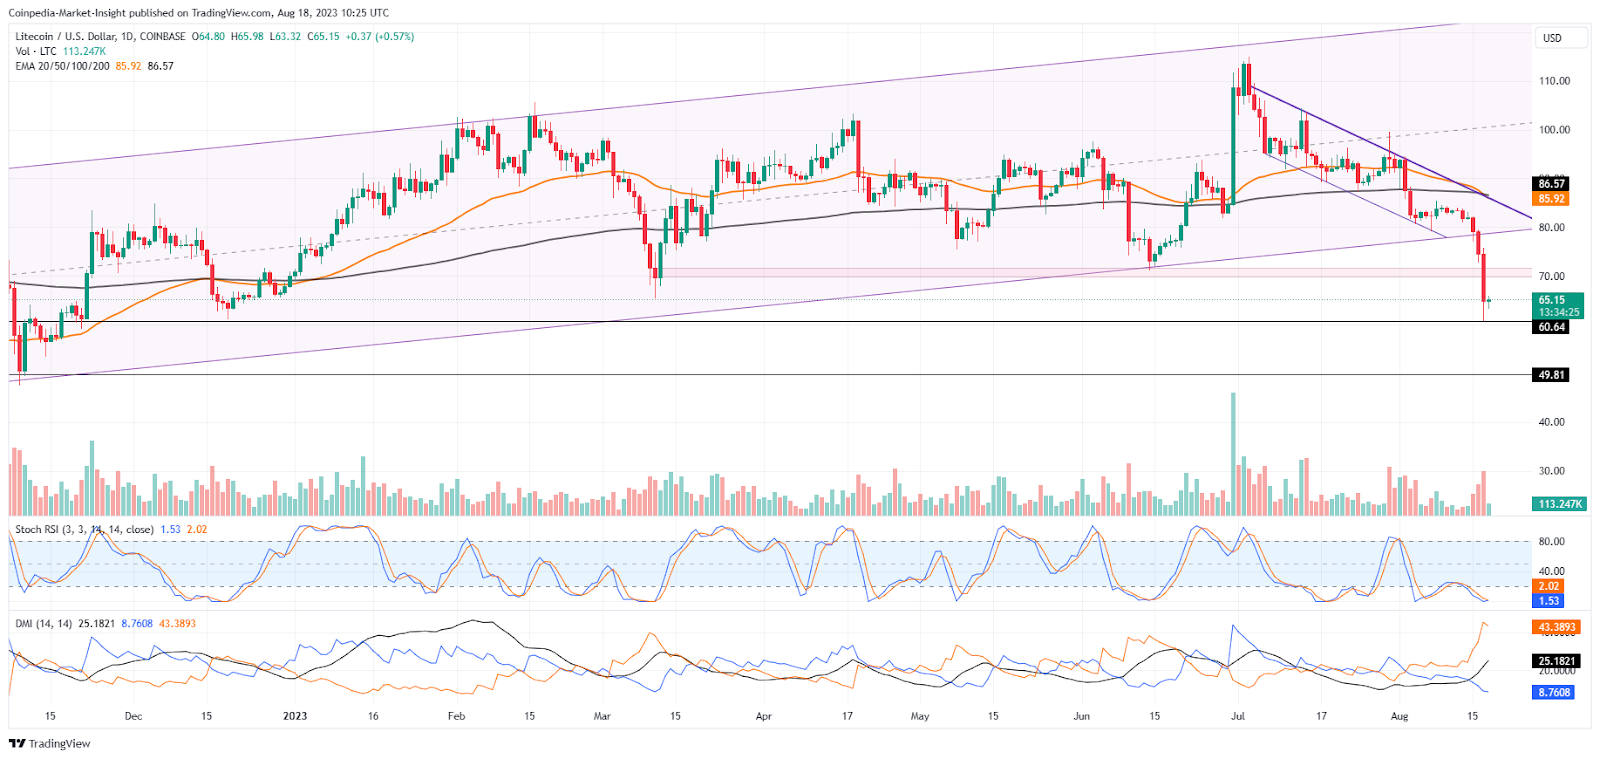
Trending lower within a channel to complete a negative cycle in a rising channel LTC price action creates a snowball effect. Coinciding with the market-wide correction, the negative cycle breaks below the support trendline.

Giving rise to a death cross, the Litecoin price is down by 22% in the last week with a spike in trading volume. Marking the daily chart in red, the LTC price action displays three consecutive bearish candles bringing the market value to $60.
Currently, the lower price rejection from $60 helps the LTC price to trade at $65 and forms a Doji candle. This comes as a relaxation period as investors prepare for the next buy or dump move.
Coming to the technical indicators, the Stochastic RSI and DMI are extremely bearish. The Stochastic RSI shows the K and D lines in the oversold zone. Meanwhile, the DMI shows a sharp increase in ADX or trend momentum with the VI lines far apart with a huge bearish gap.
Will Litecoin Price Crash To $50?
With the $70 breakdown, mentioned as a worst-case scenario in our previous LTC price analysis, the downtrend is getting severe. If the buyers fail to hold off the crash rally at $60, the following support levels are at $50 and $40, accounting for an 18% to 33% fall.
On the flip side, a consolidation move above $60 will delay the downfall and help the momentum indicators rest for a bit.
Optimistically, chances for a reversal are thin but a closing above $70 can push the trend upwards.


